 AnswerLion
ai visibility score
AI Visibility Score: What It Measures and How to Build One
Learn how an AI visibility score is built, which metrics it needs, and how to use it to prioritize the fixes that get your business named.
Published · Updated · By AnswerLion

The most popular advice on AI visibility is also the least useful. Find a tool, generate a single percentage, then try to make that percentage go up. That's a ranking mindset applied to a system that doesn't produce stable rankings, and it leads teams to celebrate random movement and panic over ordinary variation.
A defensible AI visibility score works differently. It reports a range built from repeated answers, and it separates three outcomes that single percentages collapse together: being named, being recommended, and being described accurately. Build it that way and the score stops being a vanity number. It becomes a decision tool that tells you which engine misunderstands you, which buyer questions you're losing, and which fix deserves budget next.
What an AI Visibility Score Measures Beyond Rankings
An AI visibility score measures how often and how accurately a business appears in AI-generated answers to a defined set of customer questions. It also captures how prominently the business appears. There is no fixed position to track: the same question can produce different answers on separate runs.
Search rankings assign pages places in an ordered list. AI answers distribute attention differently: several businesses may be named, one may be recommended, and another may be described with more detail. A useful score keeps those outcomes distinct rather than treating every mention as equal.
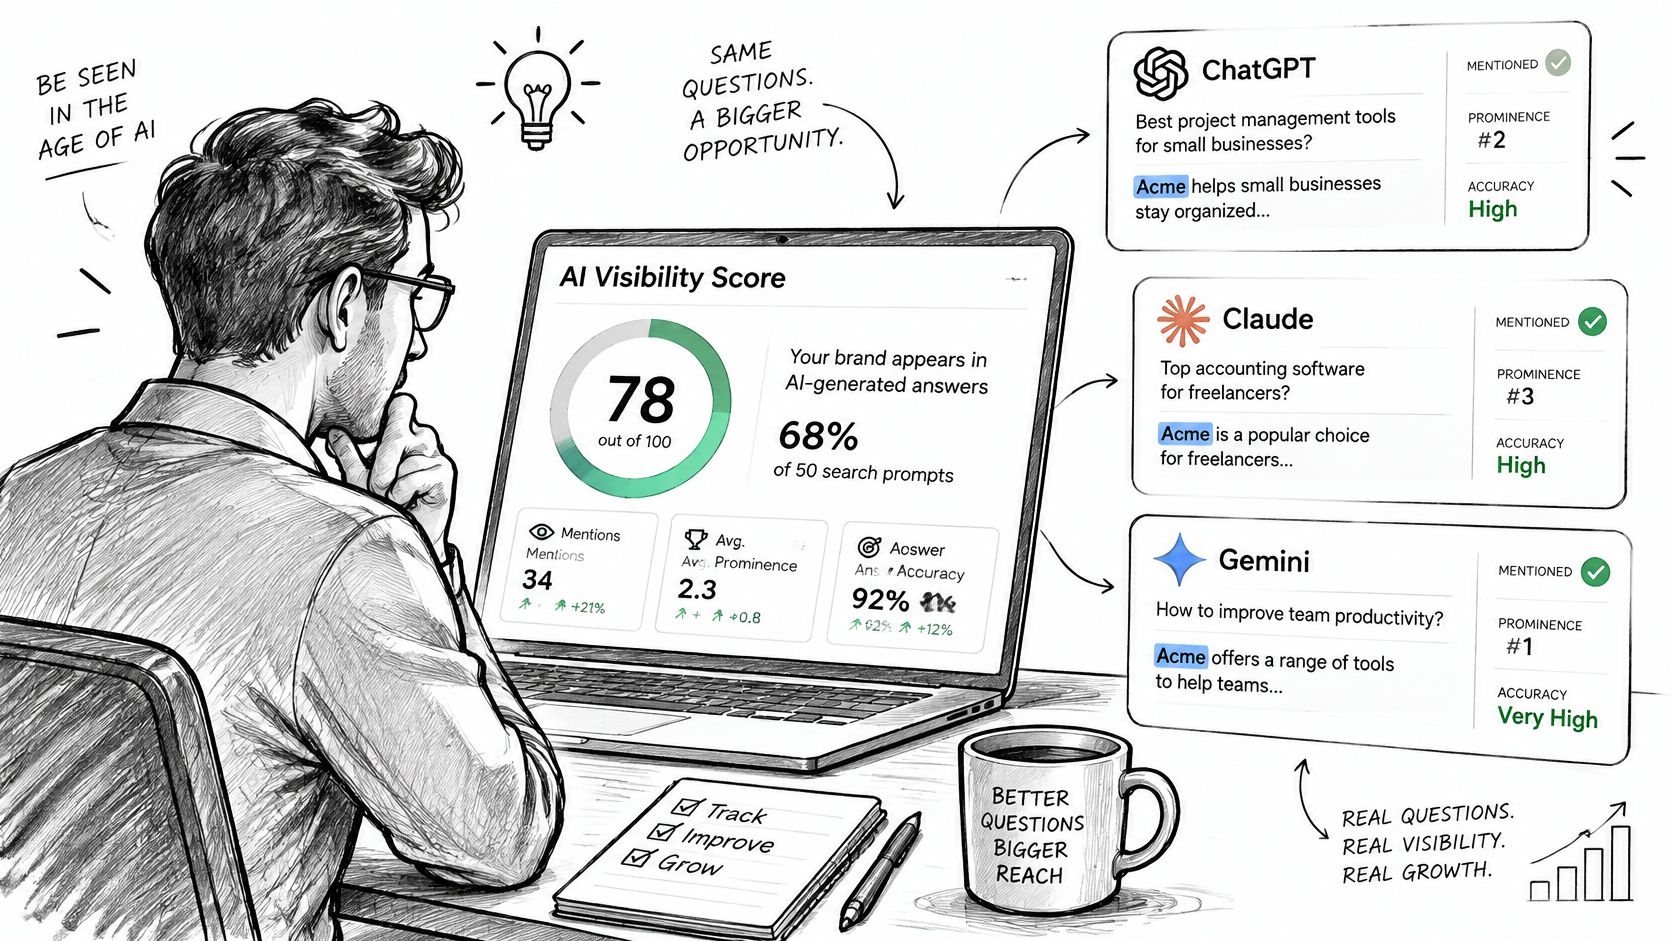
Suppose a buyer asks ChatGPT, Perplexity, and Google AI Overviews which provider fits a particular need. One engine names your business first, describes the right services, and cites a source. Another names you later but gives an outdated location. A third omits you. A conventional ranking report may show that your page is indexed and ranks well, while an AI visibility assessment reveals three different outcomes: a strong recommendation, an inaccurate description, and an omission.
Citation presence alone cannot capture that distribution. Research on generative engine optimization examines measures such as word share, position-adjusted word share, and subjective impression. Its GEO-Bench uses 10,000 queries across multiple datasets. The same research reports relative improvements of up to approximately 40% within a five-document context after optimization. These measures illustrate why a business can be cited often yet receive limited visibility if it appears late or gets little descriptive coverage. The generative engine optimization study
One Practice With Several Names
AnswerLion calls the work AEO, while GEO (generative engine optimization) describes the same practice. Both focus on helping answer engines find, understand, quote, and recommend a business. A score should distinguish a simple AI brand mention from a sourced citation, a recommendation, and an accurate description.
Practical rule: Tie every score to a fixed question set and a defined list of engines. Otherwise, changes in the questions or engines can look like changes in visibility.
Report results by engine, market, language, query type, date, and competitor set. Those segments show where visibility differs and keep unlike answers from being collapsed into one average.
The Metrics a Defensible AI Visibility Score Needs
| Metric | What it counts | Calculation |
|---|---|---|
| Inclusion rate | Responses that name the brand at all | Brand-present responses divided by valid responses |
| Recommendation rate | Brand-present responses that recommend the brand among alternatives | Recommended responses divided by brand-present responses |
| Citation rate | Brand-present responses that include a verifiable source | Responses with a source divided by brand-present responses |
| Accuracy rate | Brand-present responses that describe the business correctly | Accurate descriptions divided by brand-present responses |
| Position-adjusted visibility | Share of answer words attributed to the brand, discounted for later positions | Cited-word share multiplied by an inverse-position weight |
| Share of voice (secondary) | Brand visibility compared with competitors on the same prompts | Brand visibility divided by total visibility across the competitor set |
Start with the denominators, because they decide whether two results can be compared at all. Inclusion rate divides brand-present responses by valid responses, so it answers whether you exist in the answer set. Recommendation rate and citation rate both divide by brand-present responses instead, so each one answers a different question about the same answers where you already appear.
Mix those denominators up and you'll manufacture progress. A team that divides recommendations by all valid responses will report a low number even when the engine recommends the brand nearly every time it mentions it. A team that divides citations by all responses will hide whether the problem is absence or weak sourcing. Explicit denominators keep the diagnosis honest.
What Each Row Actually Proves
A recent scoping review on AI visibility measurement separates at least four outcomes: inclusion, whether the brand appears at all; selection, whether it's recommended or ranked among alternatives; representation, whether the answer describes the brand accurately; and sourcing, whether the engine cites authoritative evidence for the claim. It also recommends at least 5 to 10 model draws per prompt and reporting uncertainty intervals clustered by prompt, because outputs vary across runs.
Read the table with those four outcomes in mind:
- Inclusion shows presence. If you're not named, nothing downstream matters yet.
- Recommendation shows selection. The engine knows you and chooses you over alternatives.
- Citation shows evidence. The engine can point to a verifiable source for its claim about you.
- Accuracy shows representation. Prices, locations, services, and scope are right, not just present.
- Position-adjusted visibility shows prominence. It captures how much of the answer is attributed to you and how early that attribution lands.
- Share of voice shows relative standing. It compares you with named competitors on identical prompts, which makes it useful context rather than a headline.
Report these outcomes separately. Segment them by engine, model version, geography, language, intent, and date, because a single aggregate hides market-specific omissions and model drift. You're also in a stronger position when you validate the score against external measures such as search interest, market share, traffic, or sales, and when you record retrieval sources and model updates beside every reporting period.
If you can only start with two metrics, start with inclusion and accuracy. They show whether your brand exists in answers and whether those answers are right.
Everything else builds on that foundation. Recommendation work on top of inaccurate descriptions just scales the wrong story faster, and citation work on top of absence has nothing to attach to.
Measuring the Score as a Distribution Step by Step
A visibility score from one answer is an observation, not a reliable estimate of how often an engine names a business. Repeated runs expose how much results vary by prompt and engine. Save each full answer with its sources and date, then report a range rather than treating one favorable response as representative.
A study of repeated sampling across Perplexity, OpenAI SearchGPT, and Google Gemini measured results daily over nine days and every ten minutes. It found substantial variability in citation distributions, making a one-time visibility estimate unreliable as a measure of an underlying citation rate. A short-term rise may reflect a favorable retrieval; a dip alone does not show that an optimization failed.
Report the mean alongside variability, engine-by-engine results, query-level consistency, and the date range tested. Aggregate observations over rolling windows, since single snapshots can be unstable, and compare each period with a baseline range.
Building the Score in Eight Steps
Build the prompt set from documented buyer questions. Draw from sales calls, support tickets, and search queries, then group questions by informational, comparison, and purchase intent. A prompt should reflect a real decision a buyer might make.
Write three to five paraphrases per intent. Buyers express the same need in different ways, and engines may respond differently to each phrasing. Paraphrases help prevent one unusually successful wording from representing the entire intent.
Set the language, market, and engine list before the first run. Changing the scope midstream makes results harder to compare. Decide which engines and markets to include, then hold those conditions steady.
Run each prompt repeatedly and log every response. Save the full answer, cited sources, engine and model version, and date. A screenshot of a favorable answer cannot show whether the result is typical.
Classify each response using consistent denominators. Record mention, recommendation, citation, and accuracy as separate fields. An answer might cite a business while describing it inaccurately, so a single yes-or-no label loses important information.
Discount attribution that appears later in the answer. One approach is to multiply the normalized share of cited words by an inverse-position weight, such as one divided by the position of the sentence where the brand first appears. Earlier and more substantial attribution then receives a higher score.
Aggregate over rolling windows and compare with the baseline range. Treat a change as meaningful when it moves beyond the variation seen in baseline samples, rather than reacting to every shift in the center.
Track competitor share of voice and model updates. Record which competitors appear when the business does not, and note engine changes alongside results. This helps distinguish changes in visibility from changes in the system producing the answers.
Position weighting needs a clear rationale. The GEO benchmark's Position-Adjusted Word Count discounts source-attributed words that appear later in a response. Its experiment used 10,000 queries across 25 domains, with an advertiser page added alongside the top five retrieved webpages and evaluated through a retrieval-augmented generation pipeline. The measure therefore captures both how much of an answer is attributed to a source and where that attribution appears.
Why Position Weighting Changes Your Decisions
A position-adjusted measure distinguishes a brief late mention from an answer that relies on a business's information early and in detail. It can guide investigation: if a business is named but receives little attributed description, examine whether the relevant page gives engines a clear, evidence-backed answer to use. The score indicates an association with the answer, not proof that a particular page change caused it.
Consider two responses to the same comparison prompt. In one, the business appears in the second sentence, followed by sourced detail about fit, scope, and differentiators. In the other, it appears in a closing list with no description. A mention count treats them alike; position-adjusted visibility gives the first more weight.
Reporting standard: Present a band with a center, not a lone percentage. Give mention, recommendation, citation, position-adjusted visibility, and accuracy separate rows.
Compare each reporting period with the baseline range. A shift beyond that range warrants investigation; movement within it may be ordinary answer variability. This keeps teams from rewriting pages in response to noise while making sustained movement easier to spot.
Keep competitor share of voice as a secondary measure. It adds context about which businesses appear instead, but combining it with the primary outcomes obscures what changed and what action to take.
What a High Score Does Not Prove
A high score does not prove your brand is the best fit for the question. It proves the engine named you. Those are different claims, and confusing them leads to complacent reporting.
Research on LLM brand recommendations found that category-only prompts omitted established brands, and recommendation prominence was associated with broader marketplace signals such as search interest, news coverage, and online brand conversation rather than conventional brand popularity alone. Separate work in that line found consistent brand and cultural bias, including disproportionate association of global brands with positive attributes and a tendency to recommend luxury gifts for users in high-income countries.
That leaves three explanations a visibility number can't separate on its own:
- The brand is the best fit. Your offer matches the need and the engine reflects that.
- The brand is widely discussed. Search interest, news coverage, and online conversation make you prominent regardless of fit for this specific buyer.
- The model is reproducing systematic bias. Incumbency, global scale, or affluent-market assumptions tilt recommendations toward certain brands.
Each explanation demands a different response. Best fit means protect and extend. Wide discussion means your visibility is rented from attention that can fade. Bias means the score overstates your strength in some markets and understates a challenger's real fit in others.
Checks That Turn Visibility Into a Fit Read
Add five checks to your reporting. Run a relevance audit where a person reads sampled answers and judges whether the recommendation matches the prompt's constraints. Record competitor substitution patterns, meaning which brands replace you when you're absent, since that reveals who the engine treats as your true peer set. Split results by geography and language. Test with brand-free category queries so your own name does not inflate the result. Flag any pattern where visibility is high on informational questions but absent from buying prompts.
This matters most for local businesses, smaller challengers, and sectors where model priors favor incumbents. Their scores can understate real fit, and treating the score as a verdict would push them to copy incumbents instead of publishing the specific, verifiable detail that gives engines a reason to recommend them. Clean branded SEO reporting helps here because it keeps brand demand signals visible alongside answer visibility, so you can see when discussion volume is doing the heavy lifting.
The rule to adopt is simple: measure recommendation quality and fairness, not only mention frequency. A smaller score on high-intent prompts with accurate descriptions is worth more than a large score built on low-intent mentions the engine hands out freely.
Using the Score to Decide What to Fix First
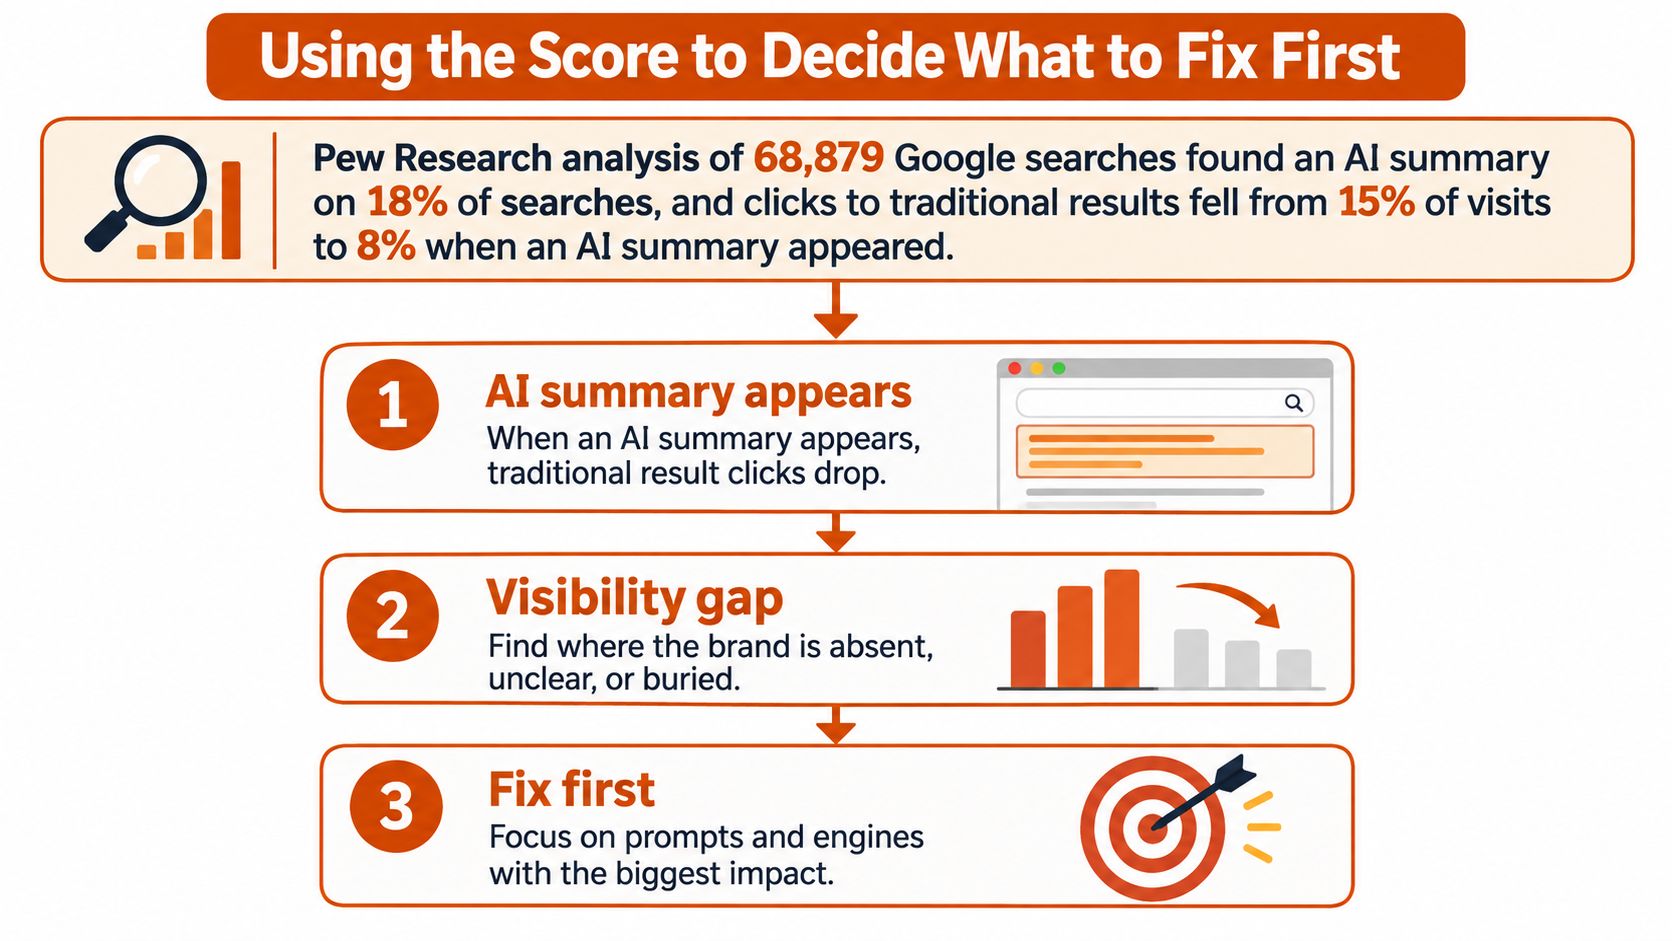
Prioritization matters because the cost of absence is already measurable. The Pew Research Center analysis of 68,879 real Google searches conducted by 900 U.S. adults in March 2025 found that an AI-generated summary appeared on 18% of searches, users clicked a traditional result in 8% of visits when a summary was present compared with 15% when only conventional results appeared, and links inside the summary itself received clicks in just 1% of visits. Users also ended their session on 26% of pages containing an AI summary versus 16% without one.
Your page can keep its ranking and still lose the visit. That's the commercial case for fixing answer visibility in a deliberate order rather than publishing content at random.
This hierarchy shows how to move from the summary's impact to the gap to the first fix.
| Score pattern | Likely meaning | Priority action |
|---|---|---|
| Low inclusion and low citation | The engine has no clear, sourced description of the business | Rewrite core pages so the opening sentence answers the question directly, and add verifiable statistics |
| High inclusion and low recommendation | The brand is named but not chosen over alternatives | Add comparison-ready content that states fit, scope and differences |
| High recommendation and low accuracy | The brand is chosen on the basis of wrong details | Correct listings, profiles and outdated pages before any new content |
| High citation and low position-adjusted visibility | The brand is sourced but appears late in the answer | Move the direct answer and the brand's evidence into the opening section of the page |
| High informational visibility and no buying-prompt presence | The brand covers research questions but loses purchase questions | Publish buying-intent pages and FAQs for the highest-value purchase prompts |
Ranking the Fixes
Address the pattern touching the most high-value prompts first. Correct accuracy before pushing recommendation, because a wrong description damages every answer that mentions you. Repair listings and profiles before writing new content, because engines draw on sources that already exist and those sources feed answer after answer. On timing, correcting an inaccurate description can show within weeks of re-crawling, while building third-party authority takes months, so sequence quick correctness wins ahead of slower authority work.
Here's a worked example using prompts affected multiplied by intent value on a 1 to 3 scale. Gap A covers pricing and comparison prompts where the brand is named but not recommended: 6 prompts at value 3, score 18. Gap B covers setup and how-to informational prompts where the brand is absent: 14 prompts at value 1, score 14. Gap C covers inaccurate service details on four listings feeding 10 prompts at value 2, score 20.
Gap C ranks first, so listings get corrected before any new content is written, and Gap A follows next quarter. Gap B has the most prompts and still ranks last, which is the point. Volume without intent value is a distraction dressed as an opportunity.
Start with a Baseline Audit This Month
Measure before changing anything. That's the decision everything else depends on, because without a baseline you can't tell improvement from engine randomness.
This summary sets out the three stages in order.
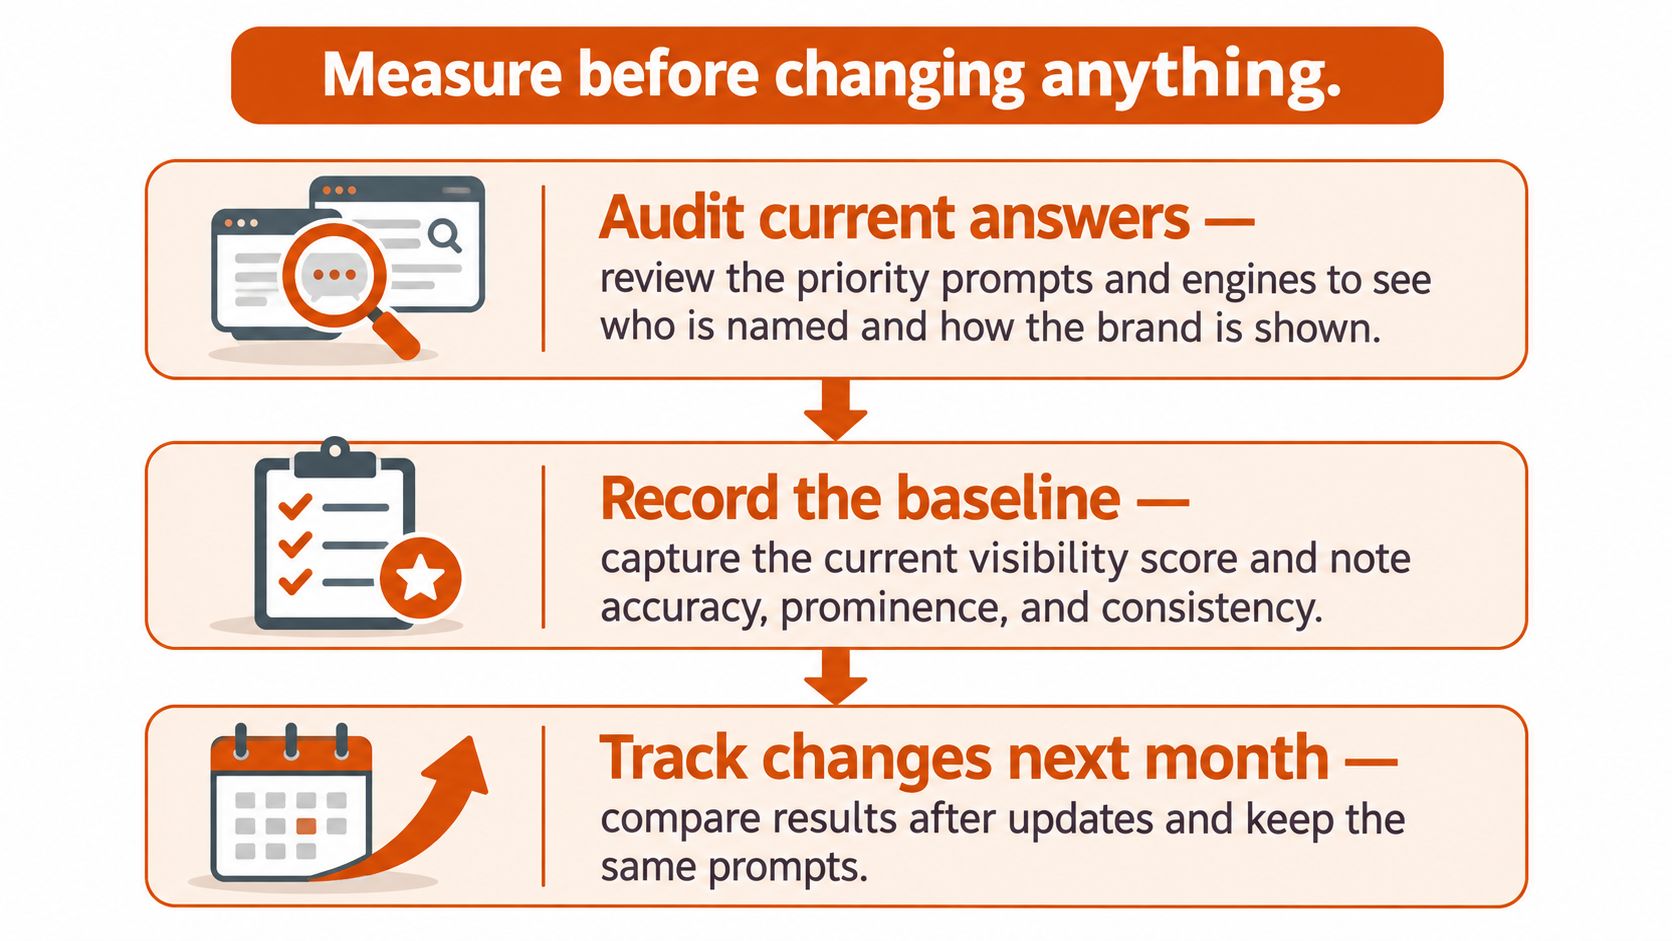
First, audit current answers across your priority prompts and engines to see who is named, how your brand is described, and who gets cited instead. Second, record the baseline as a range built from repeated samples, not a single figure. Third, fix what the pattern table flags and track the same questions against that baseline each month.
We work in three steps, Audit, Fix, and Track, with monthly measurement, and the Track step re-runs the same questions monthly and reports where your business appears, what moved, and what comes next. Our breakdown of the AI search visibility audit walks through that first stage in detail.
Before the first run, line up your priority buyer questions grouped by intent, the engines and markets in scope, a named competitor set, and the baseline date. The video below shows how that first measurement comes together.
The first measurement is the reference every later result gets judged against, so do it carefully once rather than quickly several times.
AnswerLion builds your AI visibility baseline by running your priority customer questions across ChatGPT, Perplexity, Claude, and Google AI Overviews, then fixes the gaps and tracks the same questions monthly so you can see inclusion, recommendation, and accuracy move as clear ranges. You'll know exactly where your business is named, how it's described, and which competitors get cited instead, with a prioritized plan behind every number. Visit AnswerLion to start your baseline audit this month.