 AnswerLion
search engine optimization dashboard
Search Engine Optimization Dashboard KPIs
A search engine optimization dashboard that tracks organic KPIs plus AI citations, accuracy, and demand so leaders see visibility and results together.
Published · Updated · By AnswerLion

Track rankings first and everything else second. That popular advice builds a tidy report and a weak business case. A ranking can improve on a query nobody searches, while clicks fall, priority pages drop from the index, and an AI assistant recommends a competitor by name. A strong search engine optimization dashboard reverses the order. It shows exposure, engagement, technical readiness, AI recommendation, and demand quality in one operating view, with each number tied to a source, an owner, and a decision.
The KPI Map for a Search Engine Optimization Dashboard
A search engine optimization dashboard earns its place when a marketing director reads it and assigns work in the same meeting. Build the first screen as a map, not a chart gallery. Each row names the layer, the exact KPI, the reading that signals strength, the system that produces the number, and the decision the number supports. When a row cannot change a decision, move it to a diagnostic view.
Start with Google Search Console because it is the system of record for Google exposure. Impressions tell you how often searchers saw your pages. Clicks tell you how often that exposure became a visit. CTR connects the two, and average position describes where the exposure sat. Read those four numbers together, because one number alone invites the wrong action. Rising impressions with a falling CTR ask for stronger titles, descriptions, and intent matching. Falling impressions ask you to check coverage before you commission more content.
Read the Map as Decisions
The map joins four kinds of evidence that teams often keep apart. Search performance shows demand you already reach. Index and experience checks show whether your pages are available and usable when reached. The AI layer shows whether ChatGPT, Perplexity, Claude, and Google AI Overviews name your business, describe it correctly, and cite pages you control. Demand quality shows whether that visibility reaches the CRM as branded search, direct visits, assisted conversions, and qualified opportunities.
| Layer | KPI | Strong reading | Source | Decision |
|---|---|---|---|---|
| Organic visibility | Impressions | Stable or rising over 16 months, by query and page | Search Console Performance | Investigate coverage or demand if exposure falls |
| Engagement | Clicks and CTR | CTR holds while impressions rise, clicks follow exposure | Search Console Performance | Rewrite titles and descriptions or match intent when CTR lags |
| Rank | Average position | Position gains on priority non-brand queries with traffic attached | Search Console Performance | Do not celebrate rank if queries have no demand |
| Index health | Indexed pages and coverage | Priority URLs indexed, errors declining | Search Console Indexing | Restore crawl and index access before content work |
| Experience | Core Web Vitals | LCP ≤2.5s, INP ≤200ms, CLS ≤0.1 at the 75th percentile | Search Console CWV | Fix high-traffic templates first |
| Machine readiness | Schema, robots, sitemap, llms.txt | Required fields present, AI crawlers allowed, sitemap declared | Site audit | Make pages quotable and retrievable |
| AI recommendation | Inclusion and answer position | Named on the priority question set, moving up over monthly runs | Recurring multi-engine prompt log | Expand answer-first pages where the brand is omitted |
| AI trust | Description accuracy | Facts match the site, errors cleared after recrawl | Same prompt log | Correct the source page or listing the engine is reading |
| Competitive share | Who else is cited | Share of answers versus named rivals, by question | Prompt log | Target the questions competitors currently own |
| Demand quality | Influenced pipeline | Branded search, direct, assisted conversions, and opportunity rate beside referral sessions | Analytics and CRM | Keep investment when volume is small but quality is high |
Put the Four Decisions First
Four decisions recur in every monthly review. First, does the snippet deserve the click, judged by clicks against impressions on the same query and page. Second, can Google and AI crawlers reach and index the pages that carry revenue. Third, which template deserves engineering time, ranked by traffic and the size of the experience gap. Fourth, which customer question does a competitor own today, and which page or listing will you correct to earn that recommendation.
Operating rule: Treat a 16 month Performance history as the minimum window for year over year and seasonality reads, and never let a ranking stand in for the full map.
That time window protects the conversation. A director can separate a seasonal dip from a coverage failure, and a durable gain from a short fluctuation. The result is a premium, outcome led view. Exposure grows, engagement holds, machines read the site cleanly, assistants describe the business accurately, and the CRM confirms that visibility creates demand worth funding.
Dashboard Layers and Who Uses Each One
Different readers open the same dashboard with different questions. Organize the report into five layers so each reader lands on the answer without wading through another team's diagnostics. The visual below sets out the five layers and the primary user for each one.
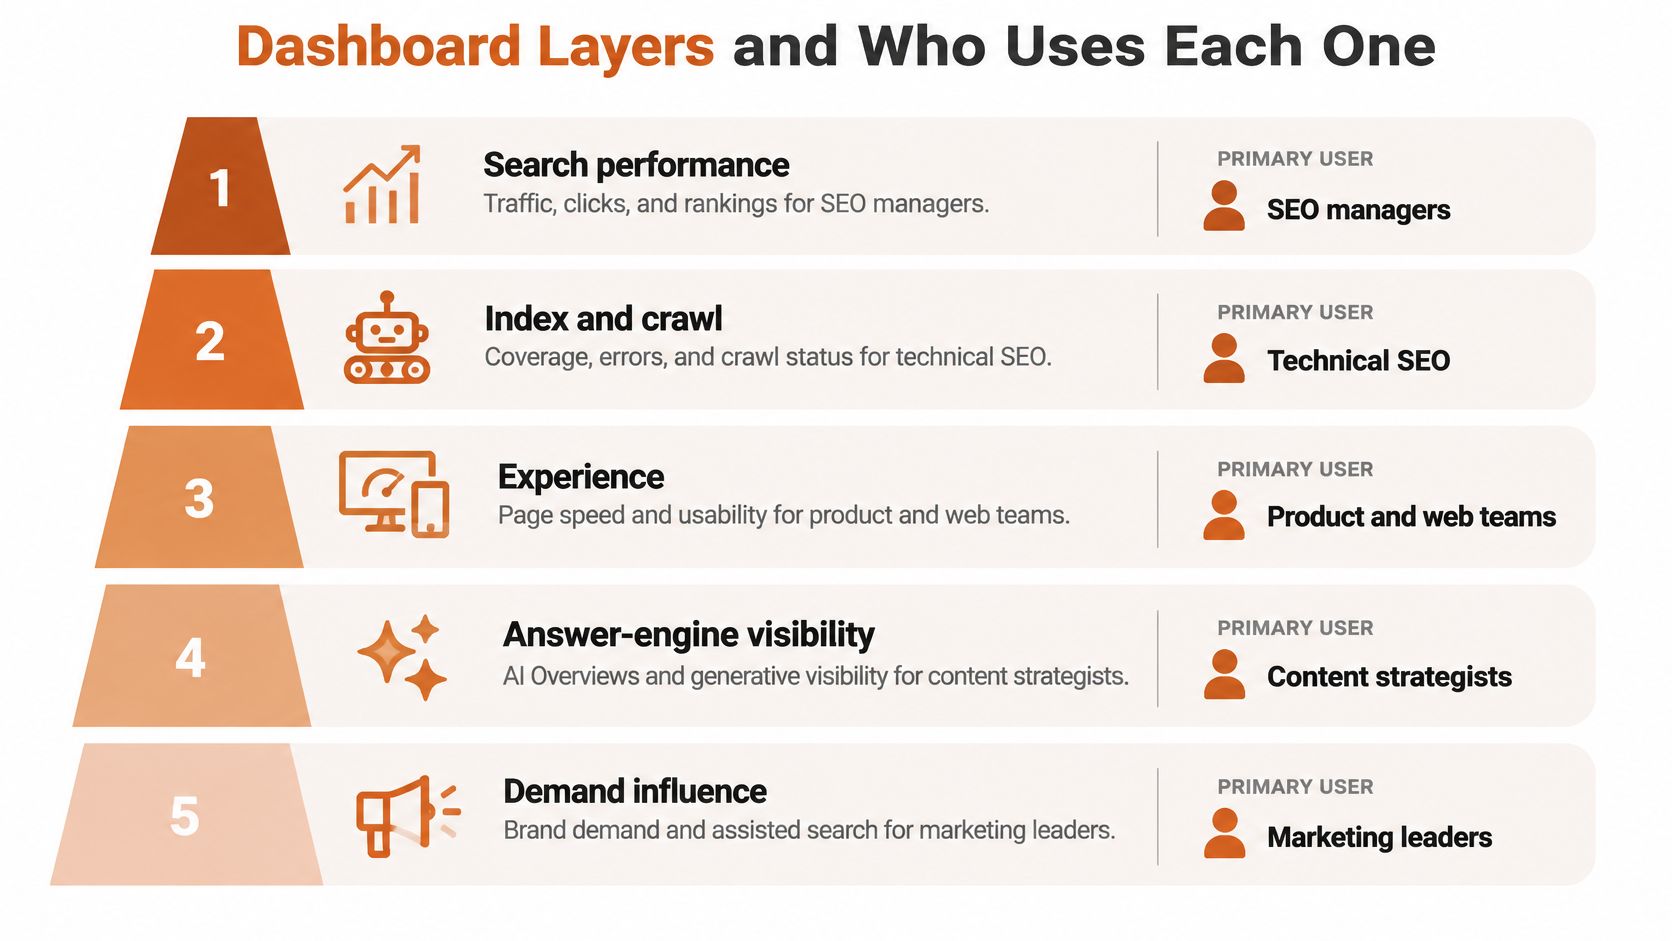
Executives read Search performance with Demand influence. Their question is direct. Is visibility turning into pipeline, and is the trend strong enough to fund the next round of pages, fixes, and authority work. Give them a five minute strip at the top. One line on exposure and clicks, one on AI recommendation movement, one on assisted demand and opportunity quality, and one on the next action. Detail sits one click below that strip, ready when a number moves.
Match Each Layer to Its Owner
SEO and content leads work in Search performance. They split queries into brand and non-brand, then read performance by page, country, and device to assign rewrites, new pages, and internal linking. That discipline aligns with branded SEO reporting, which keeps brand demand distinct from discovery demand so growth claims stay credible. Engineering and technical SEO work in Index and crawl and Experience. They open coverage errors, blocked paths, and Core Web Vitals groups ranked by traffic, because a failing product template deserves priority over a little visited archive page.
AEO owners work in Answer-engine visibility. They rerun the same customer questions on a schedule and record inclusion, answer position, description accuracy, citations, and competitor names. This layer is a separate log because Google folds AI Overviews and AI Mode into overall web totals rather than giving you a clean brand recommendation view inside standard reporting. The short walkthrough below shows how a layered view keeps those signals distinct while they stay connected.
Make Navigation Effortless
Every layer carries three navigation aids. A layer index at the top lets a reader jump straight to crawl, experience, or answer visibility. A one line status under each layer states the current read in plain words, such as priority pages indexed, mobile template improving, or brand omitted on two city questions. Each status links to the detailed entry that proves it, so a director moves from the executive strip to the exact query, URL group, or prompt that explains the change.
That path matters in a live review. The director sees demand quality rise, opens Demand influence, follows assisted conversions to the service cluster, then checks the answer layer to see which questions started naming the business. No team rebuilds the story from separate exports. Each owner sees their work, leadership sees the commercial result, and the dashboard becomes the shared record of what changed and why it paid.
Organic Visibility and Engagement Metrics
The Google funnel has a clear order, and the order is the diagnosis. Impressions come first, then clicks, then the rate that joins them. The Google Search Central announcement on the rebuilt Search Console sits behind the standard definitions used in its documentation. An impression is an instance in which a user saw a link to your site in Google Search, News, or Discover, a click is a visit from selecting that link, and CTR is clicks divided by impressions. Average position sits alongside those counts, and you can segment the full set by query, page, country, device, and search appearance type.
Those definitions give you a quantitative funnel you can teach in one minute. Impressions measure exposure. Clicks measure whether exposure earns a visit. CTR measures the efficiency of that step, and average position adds context about where the link appeared. A dashboard that reports only positions skips the commercial story. A dashboard that reports the funnel tells a content lead exactly where value leaks.
Diagnose Three Common Patterns
- Rising impressions, flat clicks: Your pages appear more often and searchers pass them by, so strengthen the title and description and check that the page matches the query intent.
- Falling impressions: Visibility or index coverage has weakened, so inspect coverage, canonical choices, and crawl access before planning new content.
- Better average position, flat traffic: The gains sit on low demand queries or search result features absorb the click, so redirect effort toward queries and pages with proven demand.
Worked example. Say a B2B software firm sees impressions grow for a comparison page while clicks stay level and CTR slips. The right move is not another page. Rewrite the title to name the comparison buyers asked for, sharpen the description with the outcome and proof, and confirm the opening section answers the comparison directly. If impressions fall across the whole cluster in the same week, switch to coverage diagnostics. The pattern assigns the work.
Build the Data Model Correctly
Search Console data needs disciplined storage, because an export isn't a complete warehouse. The Google Search Analytics API guide to getting all your data supports dimensions such as query, page, country, device, search type, date, and hour, and it limits performance data to 50,000 rows per day per search type and property. The API returns primarily top rows rather than guaranteeing every row, so present those extracts as the top rows they are and keep your trend totals built from consistent daily pulls.
Extract by date on an incremental schedule. Persist the raw API response, record the dimensions and filters used, and aggregate clicks and impressions from the stored daily extracts. Calculate CTR and average position as separate metrics from those stored values instead of averaging row level rates across unlike queries. Keep filters configurable for brand, non-brand, country, device, and content cluster, so stakeholders can isolate discovery growth from demand that already knew your name.
History makes those reads reliable. Since the 2018 redesign, Search Console has provided up to 16 months of Performance data, which supports true year over year comparison and cleaner seasonality reads. That foundation also carries the AI layer. We hold that good SEO is a foundation for AEO, and most AI engines still draw on web search results and well structured, credible pages. Strong organic measurement therefore strengthens both channels. You improve the pages Google ranks, and you improve the evidence assistants quote.
Prompt Set Design and Scoring Rubric
The AI layer starts with fixed questions and fixed scoring. Choose the questions buyers ask before they pick a provider, because those answers shape shortlists. Build three groups tied to revenue lines. Category questions ask for the best type of provider. Comparison questions ask how options differ. City or segment questions ask who serves a place, an industry, or a company size. Keep 20 to 40 questions in the set so your team can rerun every one each month with identical wording and full attention to the answers.
Tag each question with market, product, and intent at creation. A tag such as Austin, managed service, comparison lets you read movement by the lines leadership funds. Run the identical wording on ChatGPT, Perplexity, Claude, and Google AI Overviews. Store one row per engine per run, because an average across engines hides the exact place you gained or lost a recommendation. A structured method for that discipline is set out in LLM visibility tracking, which keeps the question set stable while engines change around it.
Score Every Answer the Same Way
Score inclusion as named or omitted. Score answer position as the order among businesses named, so second of four carries more meaning than a simple yes. Score accuracy as accurate, partial, or wrong against the live site, and record the competitor names that appear in the same answer. Capture the citation the engine shows, or record that it showed none.
| Field | Rule | Example |
|---|---|---|
| Question | Fixed wording tagged by market and product | Best X provider in one city |
| Engine | One row per engine per run | ChatGPT, Perplexity, Claude, Google AI Overviews |
| Inclusion | Named or omitted | Named |
| Answer position | Order among businesses named | 2 of 4 |
| Accuracy | Accurate, partial, or wrong against the live site | Partial, service area outdated |
| Citation | Source shown by the engine, or none | Source page recorded |
| Competitors | Names that appear in the answer | Three named rivals |
| Run date | Date and market of the run | Monthly, by market |
Log each wrong description against the source page or third party listing the engine appears to read. Assign the correction to the owner of that page or profile, then mark it resolved only after the next run confirms the engine now states the correct fact. Store every raw answer with its run date and market. That archive turns a monthly check into an evidence trail. You can show leadership the exact sentence that changed, the competitor it displaced, and the page your team improved to earn the shift.
AI Visibility and the Joined Signal View
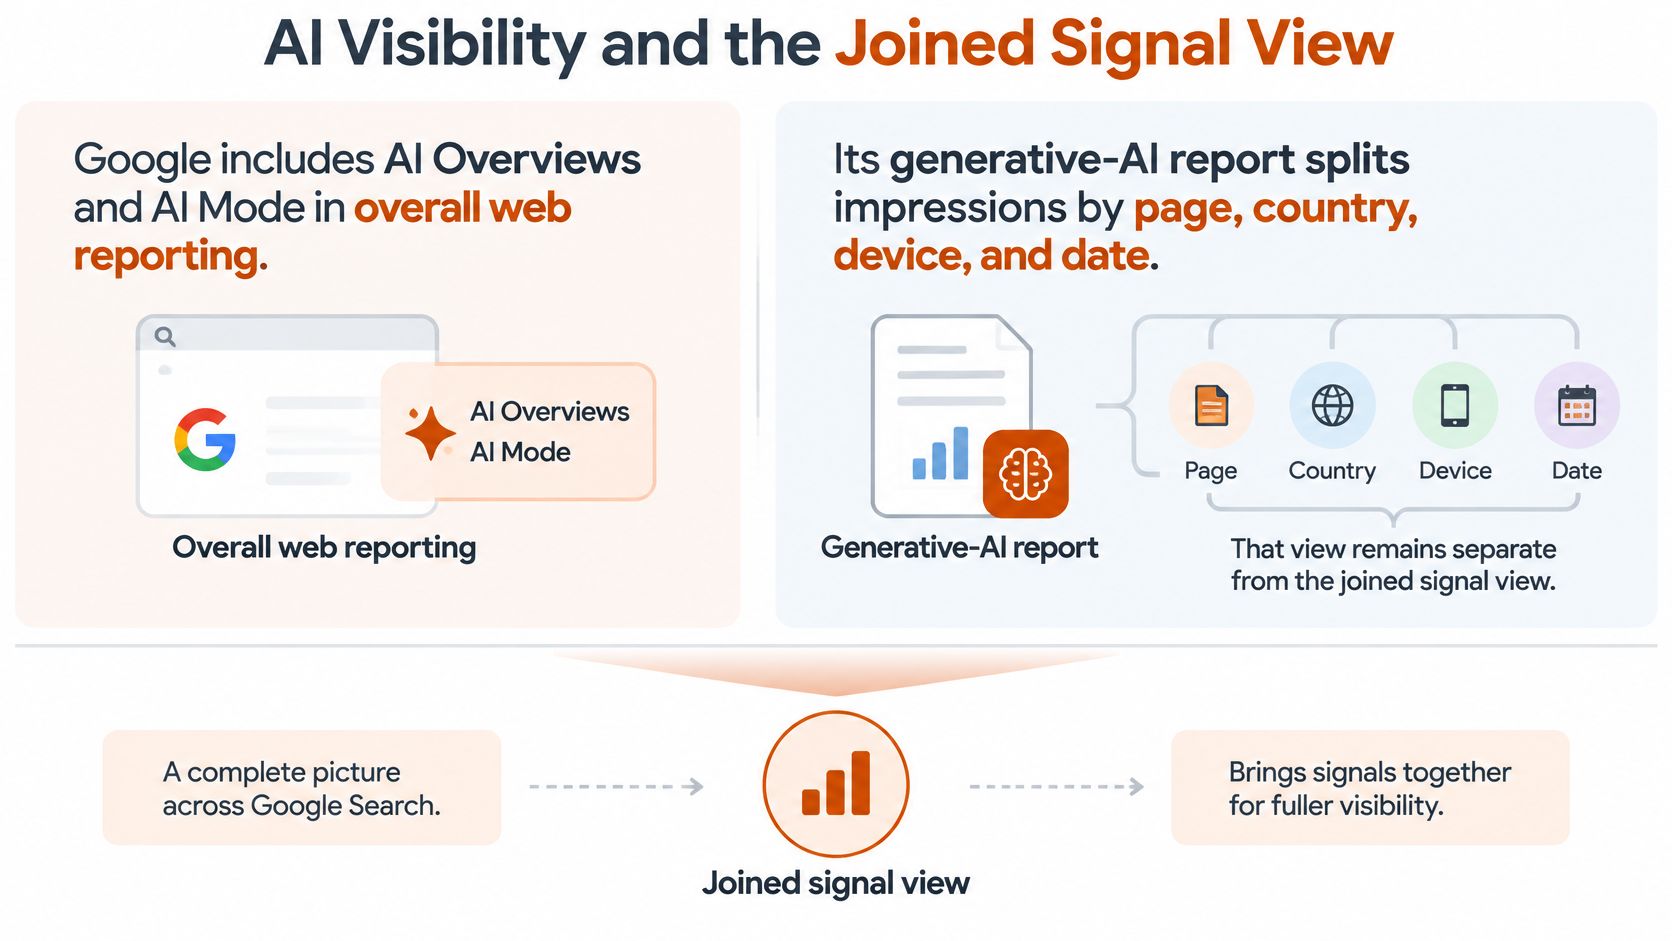
Google reporting gives you exposure. Your prompt log gives you recommendation. A joined signal view reads both together, because each one answers a different commercial question. Google's documentation on AI features and your website states that AI Overviews and AI Mode are included in overall Search Console web reporting. Its generative AI report separates impressions by pages, countries, devices, and dates. That view tells you where AI exposure occurred. It doesn't tell you whether an assistant named your business, described your service area correctly, cited your page, placed you ahead of a rival, or influenced a qualified enquiry.
The diagram below frames that gap. One side holds folded in web exposure. The other side holds the prompt level evidence your team collects directly.
Read Progress in Three Stages
Results usually come in three stages. First, AI engines start describing the business accurately. Second, they start naming it for targeted questions. Third, visibility widens to related questions as authority builds. Score your dashboard against that sequence and you will read early progress correctly. An accurate description with no recommendation yet is a foundation gain. A recommendation built on a wrong description is a trust risk that needs correction before you scale content.
AEO can show results faster than SEO because few businesses compete for AI visibility yet, AI engines re-crawl and refresh more often than search rankings move, and key inputs such as direct answers, structured data, and consistent listings sit under your control. That speed rewards a monthly log. You correct a fact, publish a clearer page, align a listing, and then verify the new answer on the next run with the date attached.
Say a multi-location home services brand asks who to use for its core service in one priority city. The month one log records omission on two engines and an outdated service area on a third. The team ships an answer first city service page that opens with the direct answer, corrected service area, proof points, and FAQs. It adds matching structured data and corrects the directory profile that carried the old boundary. On the next run, one engine names the brand second of four with the right area, and another cites the new page. That is a measurable stage move, from inaccurate and omitted to accurate and named, with the page and profile changes recorded as the cause your team will repeat in the next city.
Join the Prompt Log to Search Console
Read the two systems side by side and each mismatch names its action.
- Inclusion rising, organic clicks flat: Influence lands through branded search, direct visits, or bookmarks after the assistant names you. Credit the program through assisted demand, because last click sessions understate the win.
- Impressions falling, brand omitted: A shared coverage or crawl problem is the prime suspect. Restore indexability first, since assistants and Google both need pages they can reach and trust.
- Position improving, AI description wrong: Your site and third party listings disagree. Harmonize the facts at the source page and the profiles the engine reads, then confirm the correction on the next run.
- Small AI referral volume, high opportunity rate: Keep investing. The channel sends fewer visits and better ones, which is exactly the trade a pipeline focused director wants.
Increased AI visibility does not automatically mean increased website traffic. Measure recommendation, accuracy, and influenced demand as their own layer, and sessions become one signal among several.
Put Small Referral Numbers in Commercial Context
Scale data explains why volume ranking misleads. A large independent UserMaven B2B SaaS analysis of AI search attribution covering 15.4 million sessions across 150 websites found identifiable AI referrals represented 0.88% of total sessions. Those referrals appeared on 96% of the sites studied and AI referral sessions increased 223% during the study period. Separate market reads cited by Search Engine Land put AI referrals at 2.85% of SEO traffic in the United States and 2.44% in France, while naming AI the fastest growing channel. Small share, wide presence, fast growth. That profile calls for quality measurement now, while positions are still winnable.
So place commercial quality beside every volume number. Show conversion rate, opportunity creation, revenue influence, assisted journeys, landing page intent, and customer quality for AI referred sessions next to the same fields for non-AI cohorts. Segment by geography, product category, and customer question, because a multi-location brand can win one city and stay omitted in another. Annotate major engine changes, page launches, and listing corrections on the same timeline so movement has an explanation attached.
Label every demand figure with confidence. Observed referral means analytics directly recorded the AI source on the visit. Inferred influence means the prompt log shows recommendation growth and branded search, direct visits, or assisted conversions rise in the same market and period, while the final visit arrives through Google or a bookmark. Both labels are useful. Together they give leadership an honest, positive read. You can state what was directly observed, state what the joined signals support, and fund the next fix with clarity.
Technical Readiness Signals
Technical readiness works best as separate pass and fail checks with named owners. A single health score looks calm while one revenue template fails on mobile and a robots rule blocks the pages your content team just improved. Give engineering thresholds, affected URL groups, likely causes, and traffic rank. They will fix the right template first.
Measure Experience at the 75th Percentile
Google's Search Console Core Web Vitals report guidance classifies a URL group as Good when LCP is at most 2.5 seconds, INP is at most 200 milliseconds, and CLS is at most 0.1. Poor begins above 4 seconds for LCP, above 500 milliseconds for INP, and above 0.25 for CLS. Group values represent the 75th percentile of visits, so store the device category, date window, URL group, reporting population, percentile value, and status together.
Show status counts and the underlying percentile values. Split mobile and desktop, because they fail for different reasons and carry different traffic. Rank affected templates by visits and revenue role. LCP tracks loading performance, INP tracks responsiveness across interactions, and CLS tracks unexpected visual movement. Those plain meanings help a director approve the work. Slow first render, sluggish taps, and shifting layouts cost conversions on the pages search and AI answers send people to.
Track Schema and Crawl Controls Separately
Structured data is a set of checks, not a badge. Google's structured data policies and guidance identifies JSON-LD as the recommended format, with Microdata and RDFa also supported. Track format, missing required properties, crawl accessibility, indexing controls, and policy compliance per template. Keep Organization, Service, FAQ, LocalBusiness, and Product markup as individual rows with their own status and owner.
Article pages need the same discipline. Google's Article structured data documentation supports Article, NewsArticle, and BlogPosting and instructs publishers to validate with the Rich Results Test, correct critical errors, inspect deployed URLs, and request recrawling. Log validation errors, URL inspection outcomes, and recrawl requests against each URL. Add the recommended properties that fit the page, since completeness against the actual content beats a generic checklist.
Crawl control completes the layer. Google's robots.txt guidance defines rules that allow or block a crawler on a specified path and permits sitemap declarations using a fully qualified URL. Robots.txt governs crawling, not guaranteed exclusion from search, so use noindex or authentication when exclusion is the goal. A practical build sequence for that file is covered in how to generate a robots.txt file. Add AI crawler access, a clean XML sitemap, server rendered HTML, and a current llms.txt summary as separate rows, each with the owning team.
| Check | Pass line | Owner |
|---|---|---|
| LCP | ≤2.5s at the 75th percentile, Poor above 4s | Engineering |
| INP | ≤200ms at the 75th percentile, Poor above 500ms | Engineering |
| CLS | ≤0.1 at the 75th percentile, Poor above 0.25 | Engineering |
| JSON-LD schema | Required properties present, Rich Results Test clean | SEO or development |
| Article markup | Recommended properties that fit the page, validated and inspected | Content operations |
| robots.txt | Priority paths allowed for Googlebot and AI crawlers | Technical SEO |
| Sitemap declaration | Fully qualified sitemap URL in robots.txt and a clean XML sitemap | Technical SEO |
| Index control | noindex or auth used when exclusion is the goal, not a robots block alone | Technical SEO |
| llms.txt | Current business summary published and linked | AEO or content lead |
Quick Lookup for Cadence Owners and Thresholds
A lookup card keeps the operating rhythm visible between monthly reviews. Pin it where owners plan work. Each row answers three questions at a glance. What refreshes, how often, and who owns the read.
| Rhythm | What to refresh | Owner |
|---|---|---|
| Daily extract | Clicks, impressions, queries, pages, device, country | Analytics or SEO ops |
| Weekly | Coverage, crawl errors, vitals on top templates | Technical SEO and engineering |
| Monthly prompt run | Inclusion, accuracy, position, competitors by question | AEO lead |
| Monthly readout | What changed, what engines say, next actions | Marketing lead |
| 16-month window | Year-over-year Performance trends | SEO lead |
Run the Rhythm Without Drift
Pull Search Console data incrementally by date and persist the raw rows with their dimensions and filters. That habit keeps totals consistent month to month and makes any sudden change traceable to the exact extract. Each week, technical SEO and engineering review coverage errors, new crawl blocks, and vitals status on the templates that carry the most traffic. Small weekly fixes keep the monthly readout focused on growth instead of recovery.
Every month, rerun the same customer questions with identical wording and record inclusion, accuracy, answer position, citations, and competitors. Publish the readout so a non-technical owner can read it in about five minutes. Cover what engines say now, what changed since the last run, and what happens next. Assign ownership clearly across the card. SEO owns queries and CTR, engineering owns vitals and crawl fixes, content owns answer first pages, and the AEO lead owns the prompt log and its corrections.
Use the 16 month window for every seasonality and year over year claim in the readout. Shorter windows still help weekly diagnosis, and they stay labeled as short windows. For quick threshold checks, the Good lines are LCP 2.5 seconds, INP 200 milliseconds, and CLS 0.1, each read at the 75th percentile for its URL group and device.
Keep One Glossary for Every Reader
- AEO and GEO: Two names for the same work of being cited and recommended by AI assistants.
- Impression, click, CTR: Search Console exposure, the visit from selecting the link, and clicks divided by impressions.
- Inclusion: The business is named in an assistant's answer to a tracked question.
- Inferred influence: Demand that arrives through branded search or direct visits after an AI mention shapes the shortlist.
Point each glossary term back to its layer, and the card works as an index readers trust. A director who questions a term reaches the detail in one move, and the meeting stays on decisions.
Start Monthly Tracking from a Baseline
A useful baseline separates two kinds of visibility: search performance and whether AI assistants name and accurately describe your business. Track them as distinct measurement layers. Search Console reports search activity; a recurring AI question set shows which businesses assistants cite and how they describe them.
- Set the priority questions: List the category, comparison, and city or segment questions where your business should appear. Tag each by market, product, and intent.
- Record the starting point: Capture Search Console's 16-month trend, the index status of priority URLs, and Core Web Vitals for key templates. Separately, record how ChatGPT, Perplexity, Claude, and Google AI Overviews answer your priority questions, including which competitors they recommend.
- Address the biggest gaps: Rewrite pages to answer omitted questions directly, add relevant schema, check crawler access and sitemap settings, and correct inconsistent third-party listings.
- Repeat the same checks monthly: Use identical questions and wording so changes in inclusion, accuracy, and competitor citations are comparable over time.
- Turn movement into action: Each review should identify what assistants say, what changed, and which content or technical fix comes next.
AnswerLion is an answer engine optimization agency that helps businesses get cited and recommended by AI assistants. Its work starts with a baseline audit of how assistants answer priority customer questions, then applies content and technical fixes. Monthly tracking shows where the business appears in AI answers and what has changed, in a plain-language report designed to be read in five minutes. Search performance and AI visibility remain distinct signals; the AI report focuses on assistant answers, not a joined Search Console or demand view.
Build your baseline by listing the questions customers ask and recording how major assistants answer them today. AnswerLion can audit those answers, fix content and technical issues, and track changes in its monthly report. Visit AnswerLion to start measuring your visibility in AI answers.